Goodehealth Dashboard
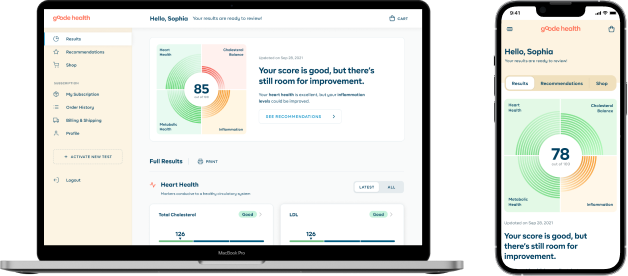
Demo / PrototypeRoleDurationTeammatesToolsLive Website
- User Researcher
- UI Design
- Prototyping
- Figma
Overview
Goodehealth's main goal is to deliver a personalized health experience.Educating their users on their health through their personal blood
test kit data.
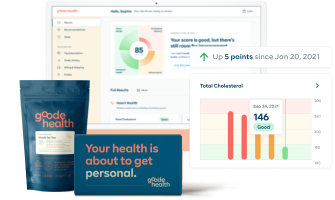

BackgroundDuring the fall of 2021 Goodehealth approached Lumber with
proposition of recreating their product technology from the ground
up, as they were unsatisfied with the previous agencies outcome.
Our ObjectiveResearch, strategize and design an end-to-end web experience to help
modernize their product and reduce load to their customer experience
team.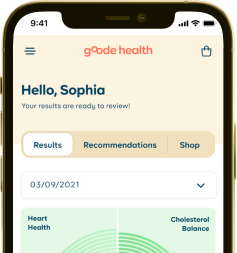

 The Problem
This situation creates frustration for both the customer experience staff and users of the product. It also represents an avoidable time cost to both parties.
 The Challenge
Design Timeline
Research
- Heuristic / Usability Evaluation
- Intake and Alignment with Goodehealth
- Competitor Analysis
Design
PHASE 1
- App Structure
- Site Map / User Flows
- Design Exploration
PHASE 2
- Design System
- Feedback
- High Fidelity Prototype
Launch
- Product Launch
- Retrospective
My Role
Facilitated communication between Goodehealth and our team regarding
design decisions. Provided our developers with UX flow-walkthroughs,
and Design QA documents. Regularly ensuring that they were always in
the loop with what Design was up to.

What success looks like
Increase in users ordering recurring blood test kits
Increase in activation rate of the blood test kit product
Acquisition of more users for their partner services
Research Findings
Research Process
 CX and Analytics Team Meetings
 Competitor analysis
 Application audit
Heuristic and Usability Evaluation
From the beginning we wanted to alleviate the many pains Goodehealth as a client had with their product. We took a broad look onwards to the entire product and found many issues that further reinforced the burden upon the CX Team and Customers.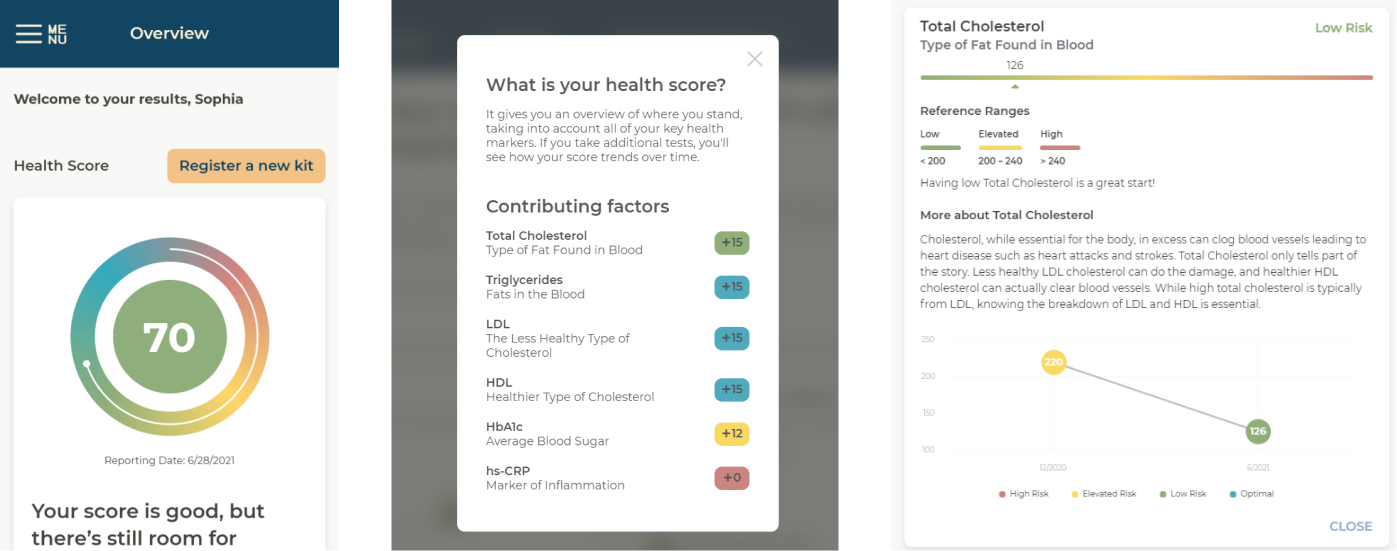 Old Dashboard Experience
Subscription Management
Not knowing where to click
Inability to find key actions
Lack of Proper error Prevention
Management was on e-commerce site only
 Previous Subscription Management
Results Overview
Color for severity Ranges were confusing
Blue was “better” than green
Comparison slider component
 Health Score
Results Overview
Graph lacks clarity and the user can't interact with individual data points
Biomarker sections are not distinguishable
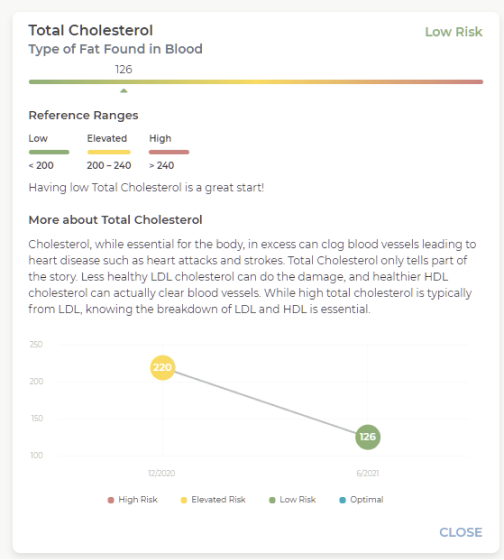 Biomarker Card View
Results Overview
Rounding Error within Formula
Breakdown of score hidden behind modal
Color ranges were decorative rather than functional
 Health Score on Overview
Evaluation Takeaways

System status was not clear in many casesNo visual feedback given to when the user completes actions

Confusion around scientific termsScientific terms without proper labeling or accompanying information

Issues with component clarityText links without underlying, proper contrast, buttons without touch targeting on mobile
CX and Analytics Insights
By the numbers: Subscribe on spot to the product
 Users never registered their blood kit
 Users use the dashboard on mobile

0
01234
0
%
0
01
012345
0
0

0
01234567
0
%By the users (insights via CX team): Trouble managing Subscriptions
 Confusion registering Blood Test Kit
 Trouble managing Subscriptions
 Confusion registering Blood Test Kit
Competitor Analysis
There were many key solution elements we wanted to tackle with the redesign. Taking a look at other competitors from a quantitative feature comparison and how they handled these features would help us better gain insight and growth for the redesign. The framework for our analysis was as follows: strengths, opportunities and weaknessesCompetitor Analysis Key Takeaways
 Data should be comparable
 Data should be interactive
 Accompanied with teachings
 Data should be comparable
 Data should be interactive
 Accompanied with teachings
Design - Phase One
Information Architecture
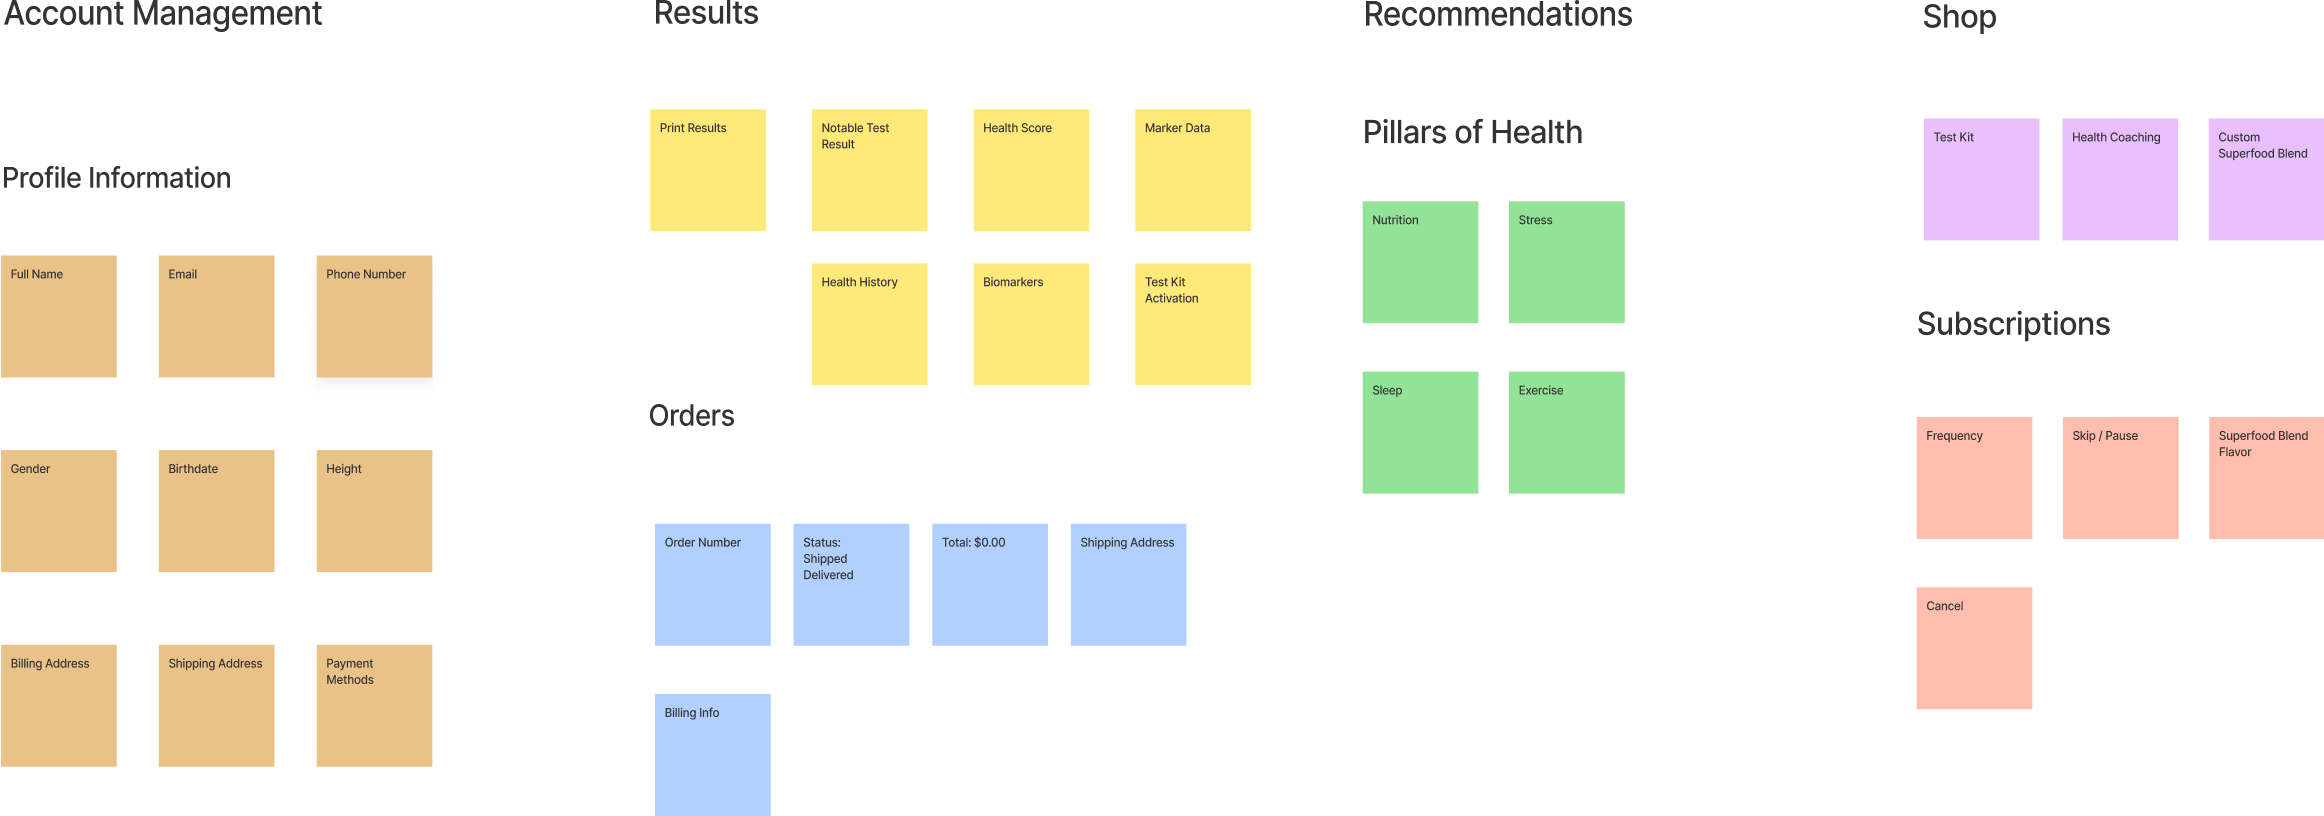 Affinity Mapping Results
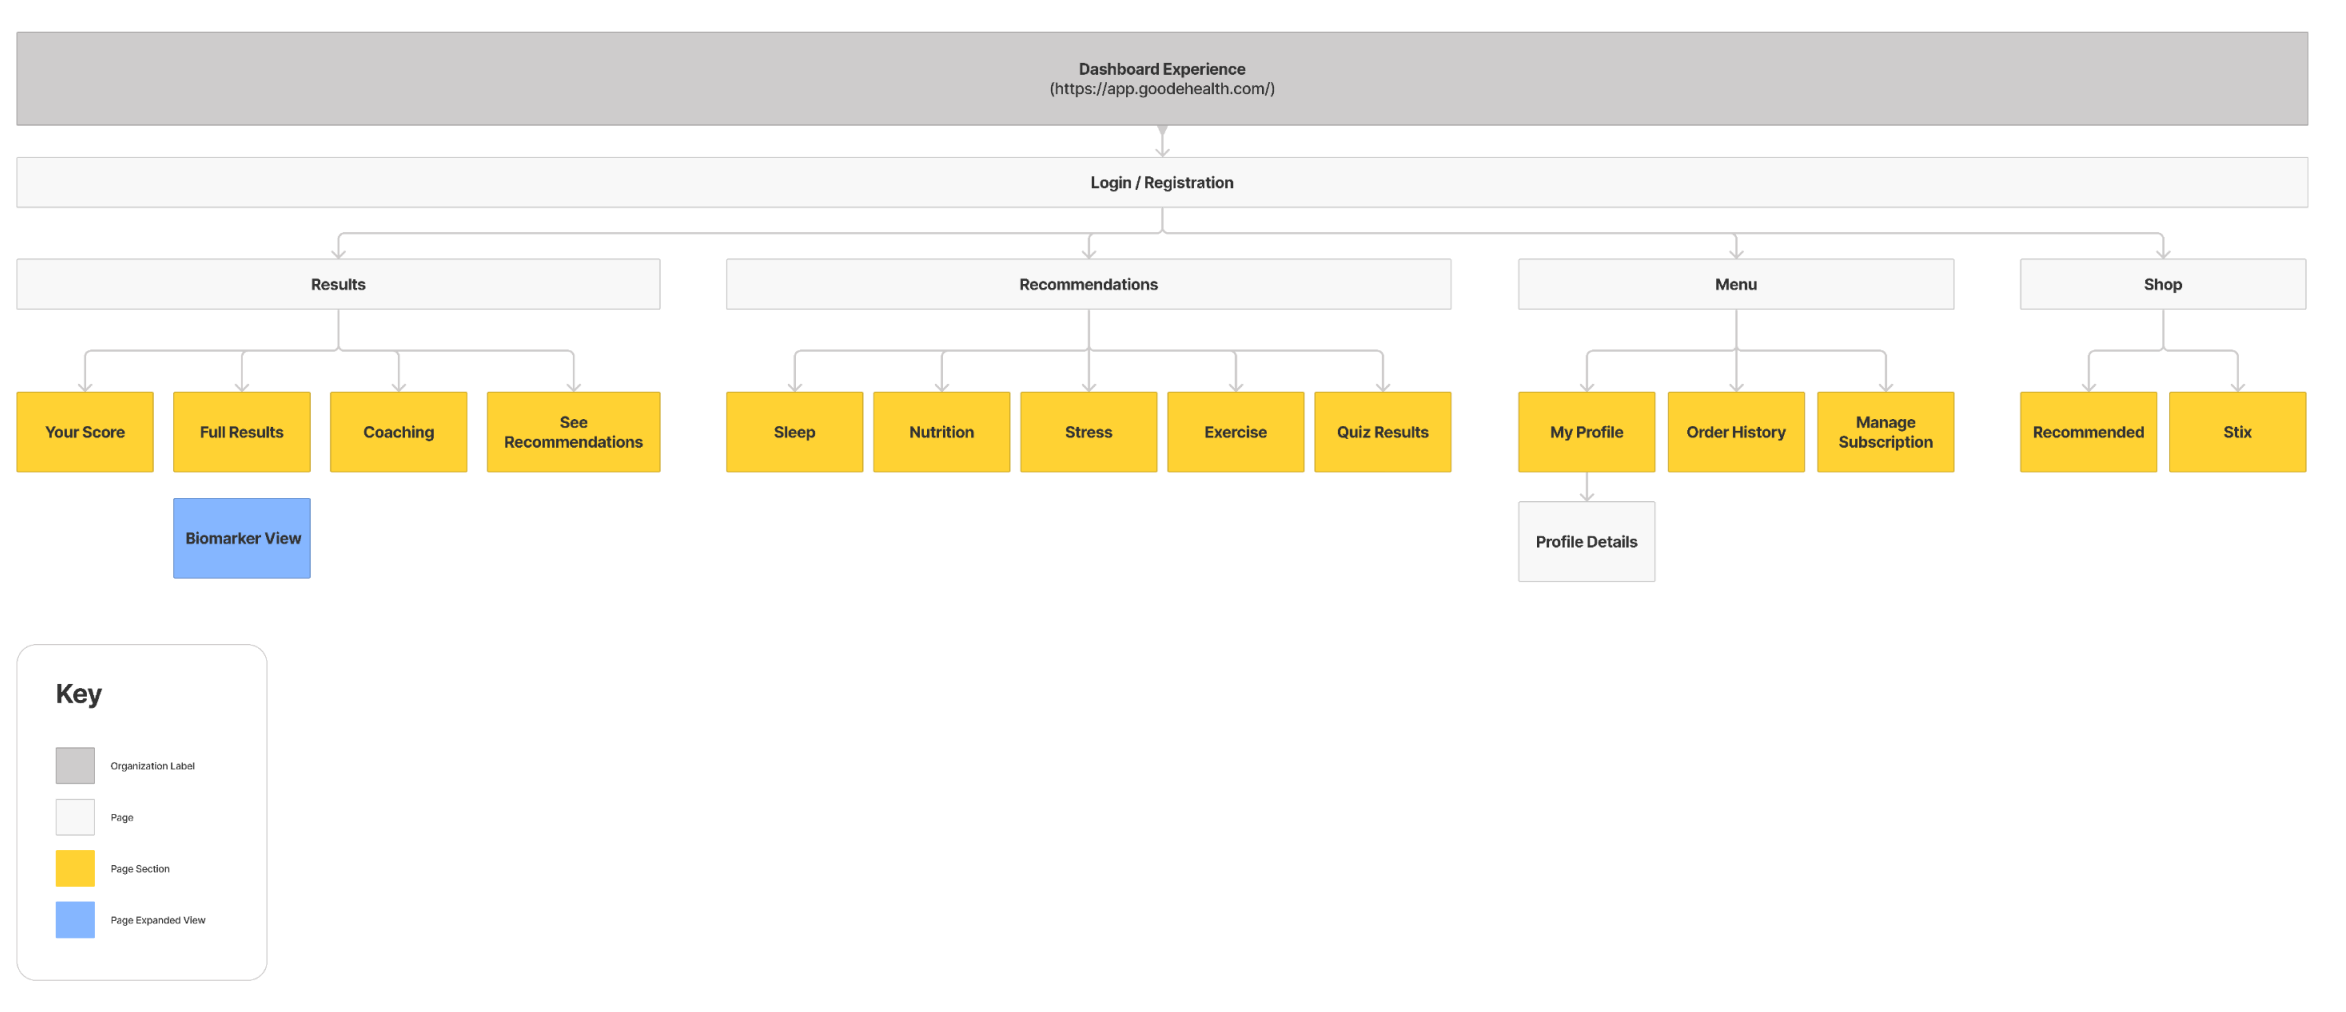 Initial Sitemap based on Affinity Mapping
User Flow and Journeys
Once as a group we were satisfied with the architecture of the dashboard we moved onto mapping out the key user flows we wanted to address with the redesign and our user journey maps.
Takeaways
The disconnect between the digital and physical product that needed to be addressed. We decided an avenue to solve for this was to introduce friction at key points of the user journey.Registration flow

Onboarding / blood kit “Waiting room”

Biomarker card flow

Subscription management flow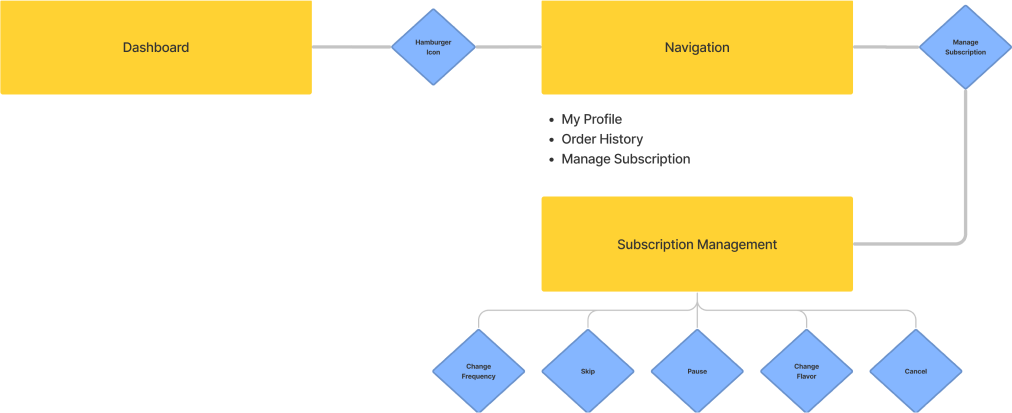

Low Fidelity Wireframes
Biomarker card flow As we wanted to present a prototype to the stakeholders we focused on trouble areas to display within the wireframe flows. These included the registration, main navigation pages and subscription management.
Iterations
Early Biomarker and Health Score Visualizations Main PagesThese are the main pages of content through out the experience. They are also directly tied with the navigation.
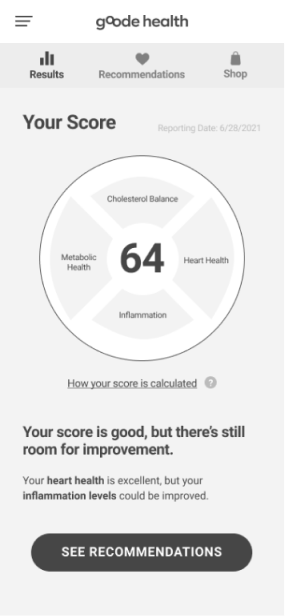 Results/Home
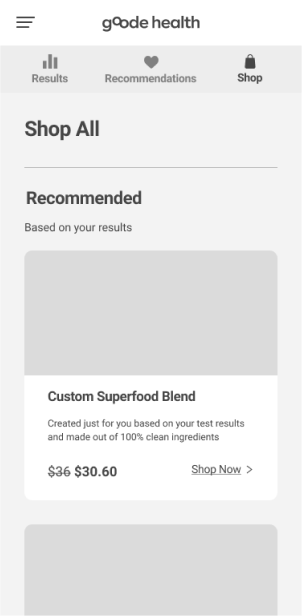 Shop
Shop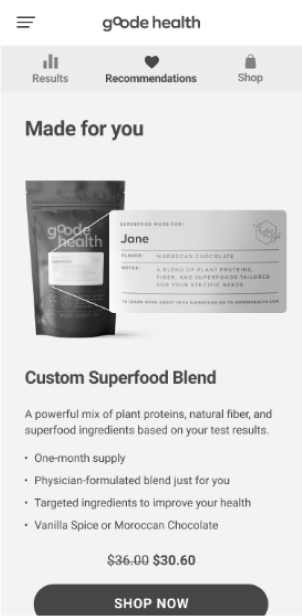 Recommendations
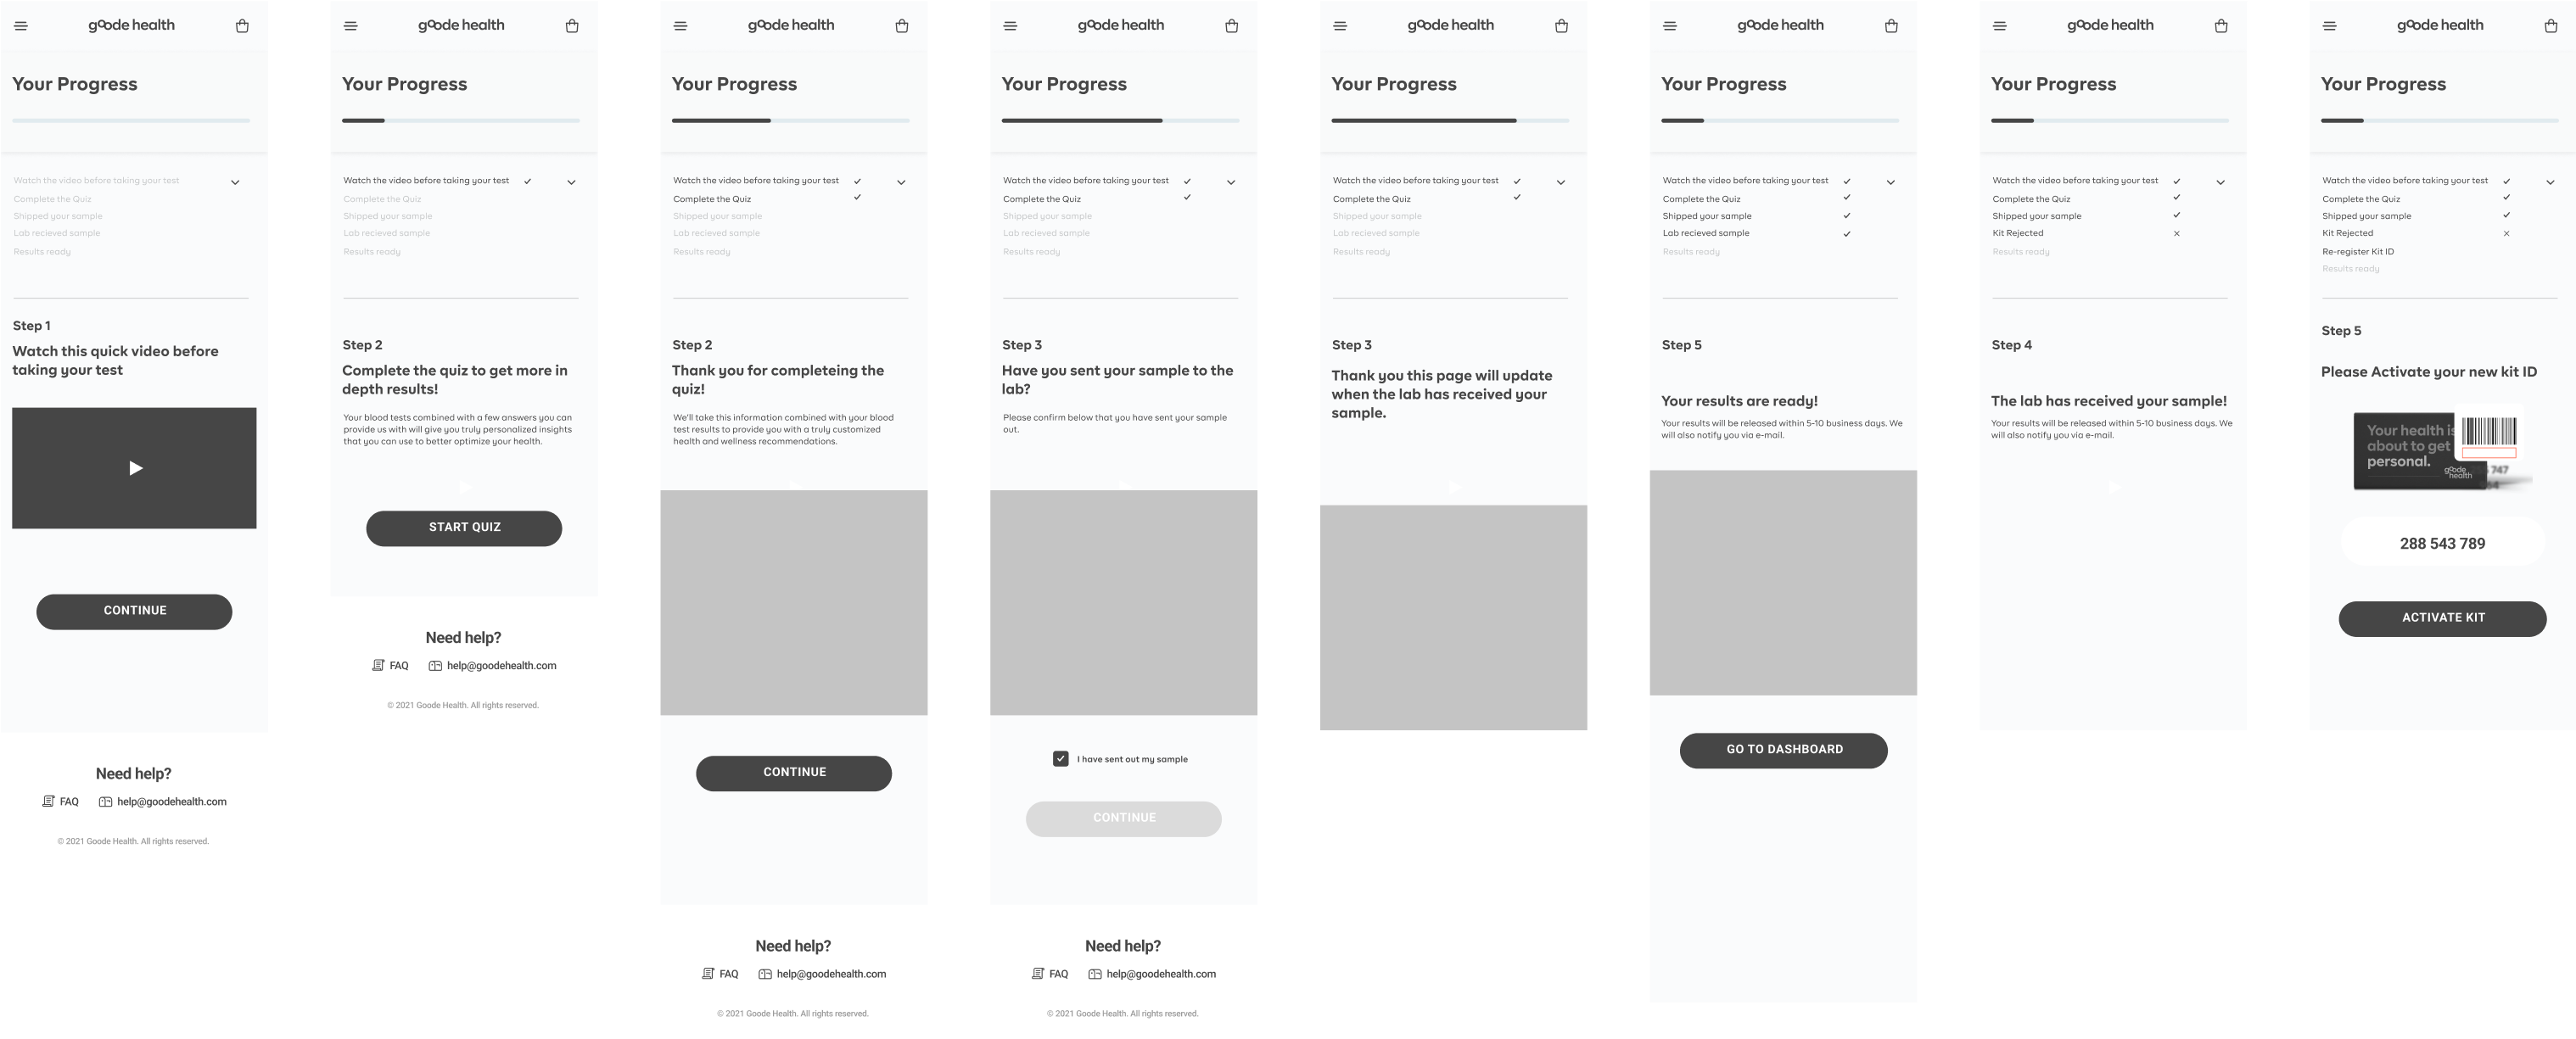
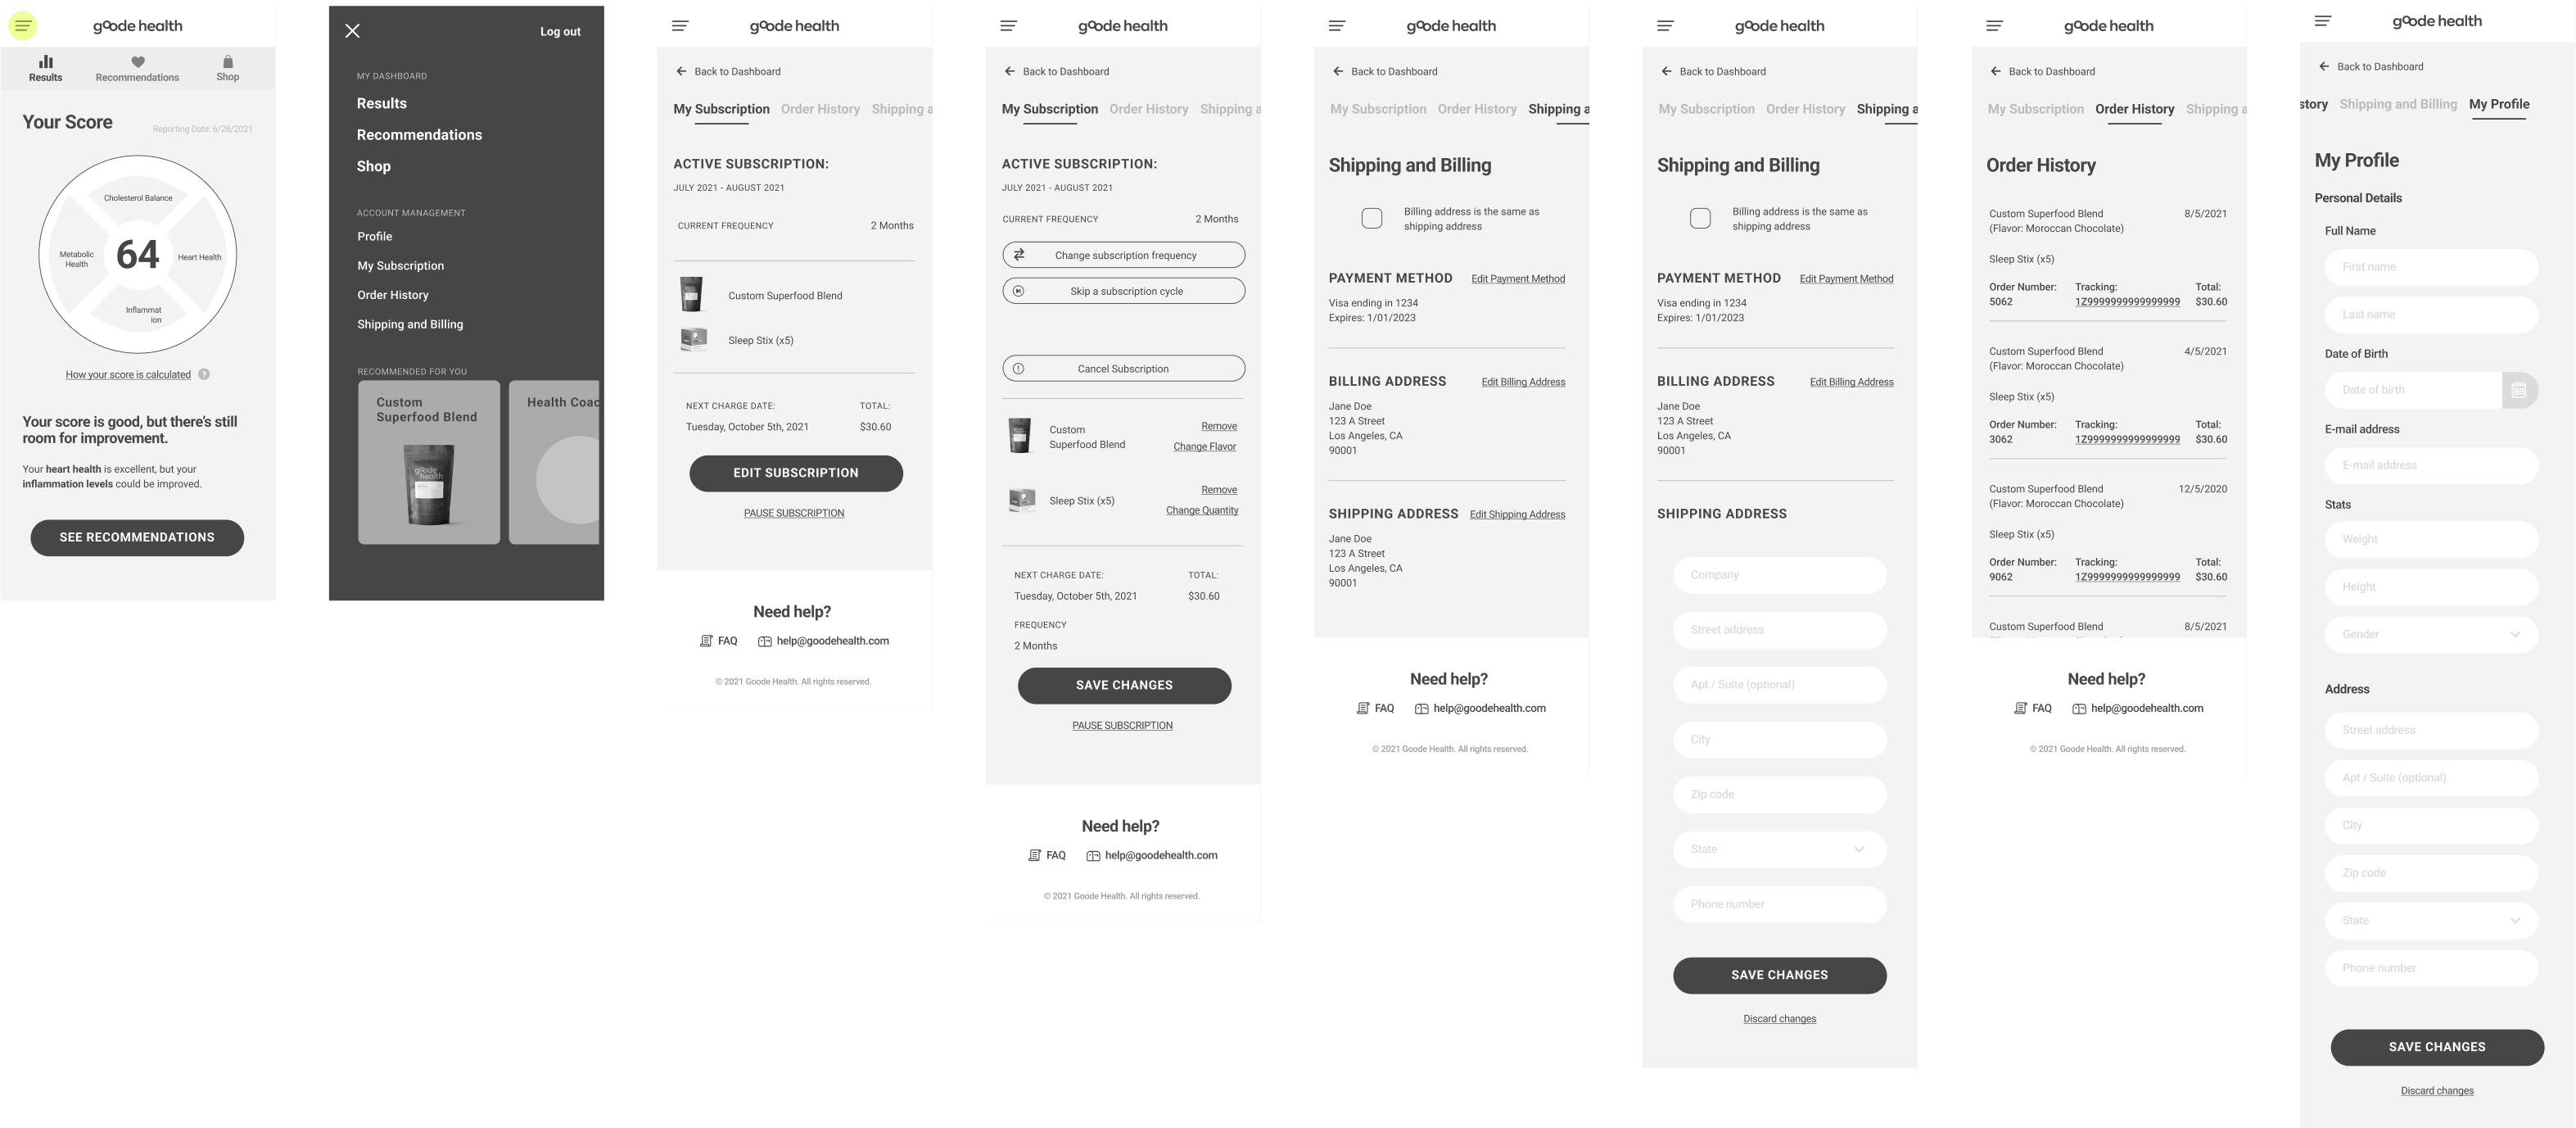 Onboarding / blood kit “Waiting room flow”
Outcomes
After all the new information we had gained, we presented our findings to the stakeholders. We decided to create a few goals and principles we would focus our solution on.Design Principles
Educate, and empower users to explore the product

Bridge gap between physical and digital aspect of the product

Address the major CX pain points

Modernize the UX from a heuristic perspective
Design - Phase Two
Design System Co-Creation
We were on a very tight deadline and developers needed to start building soon. This part was lead by my coworker YP as she was brought into the project for her experience creating design systems.Typography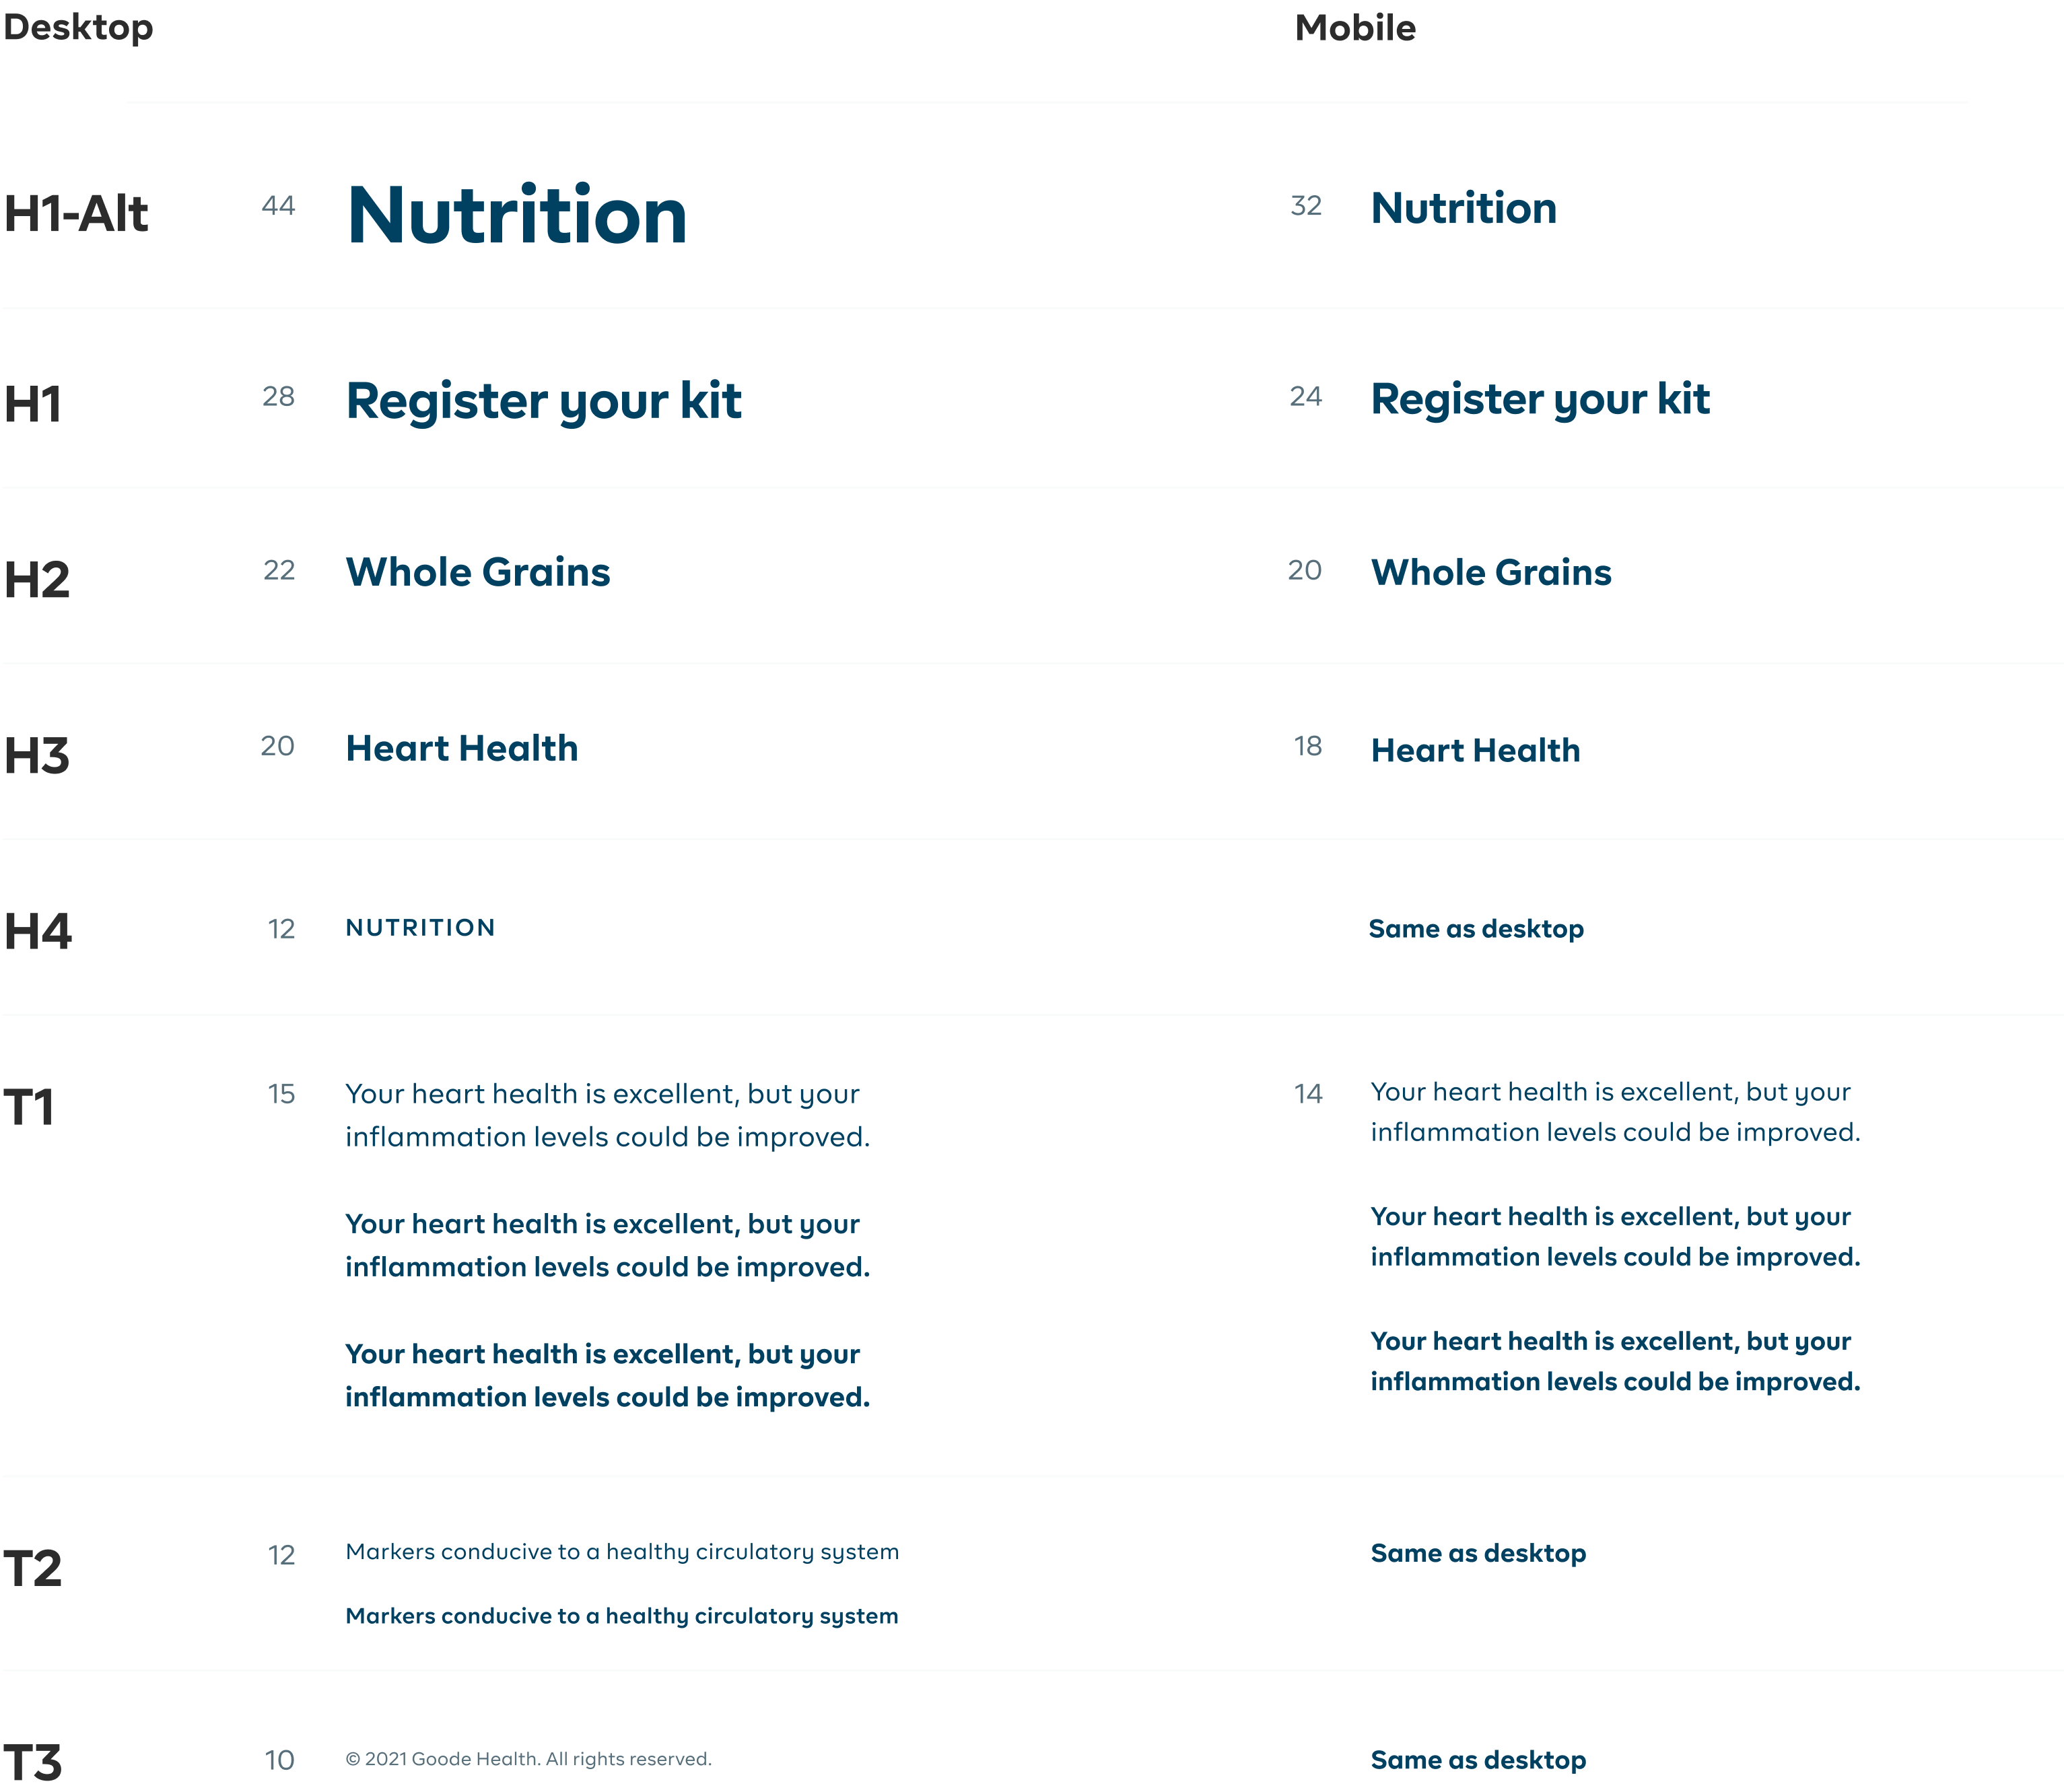

Elements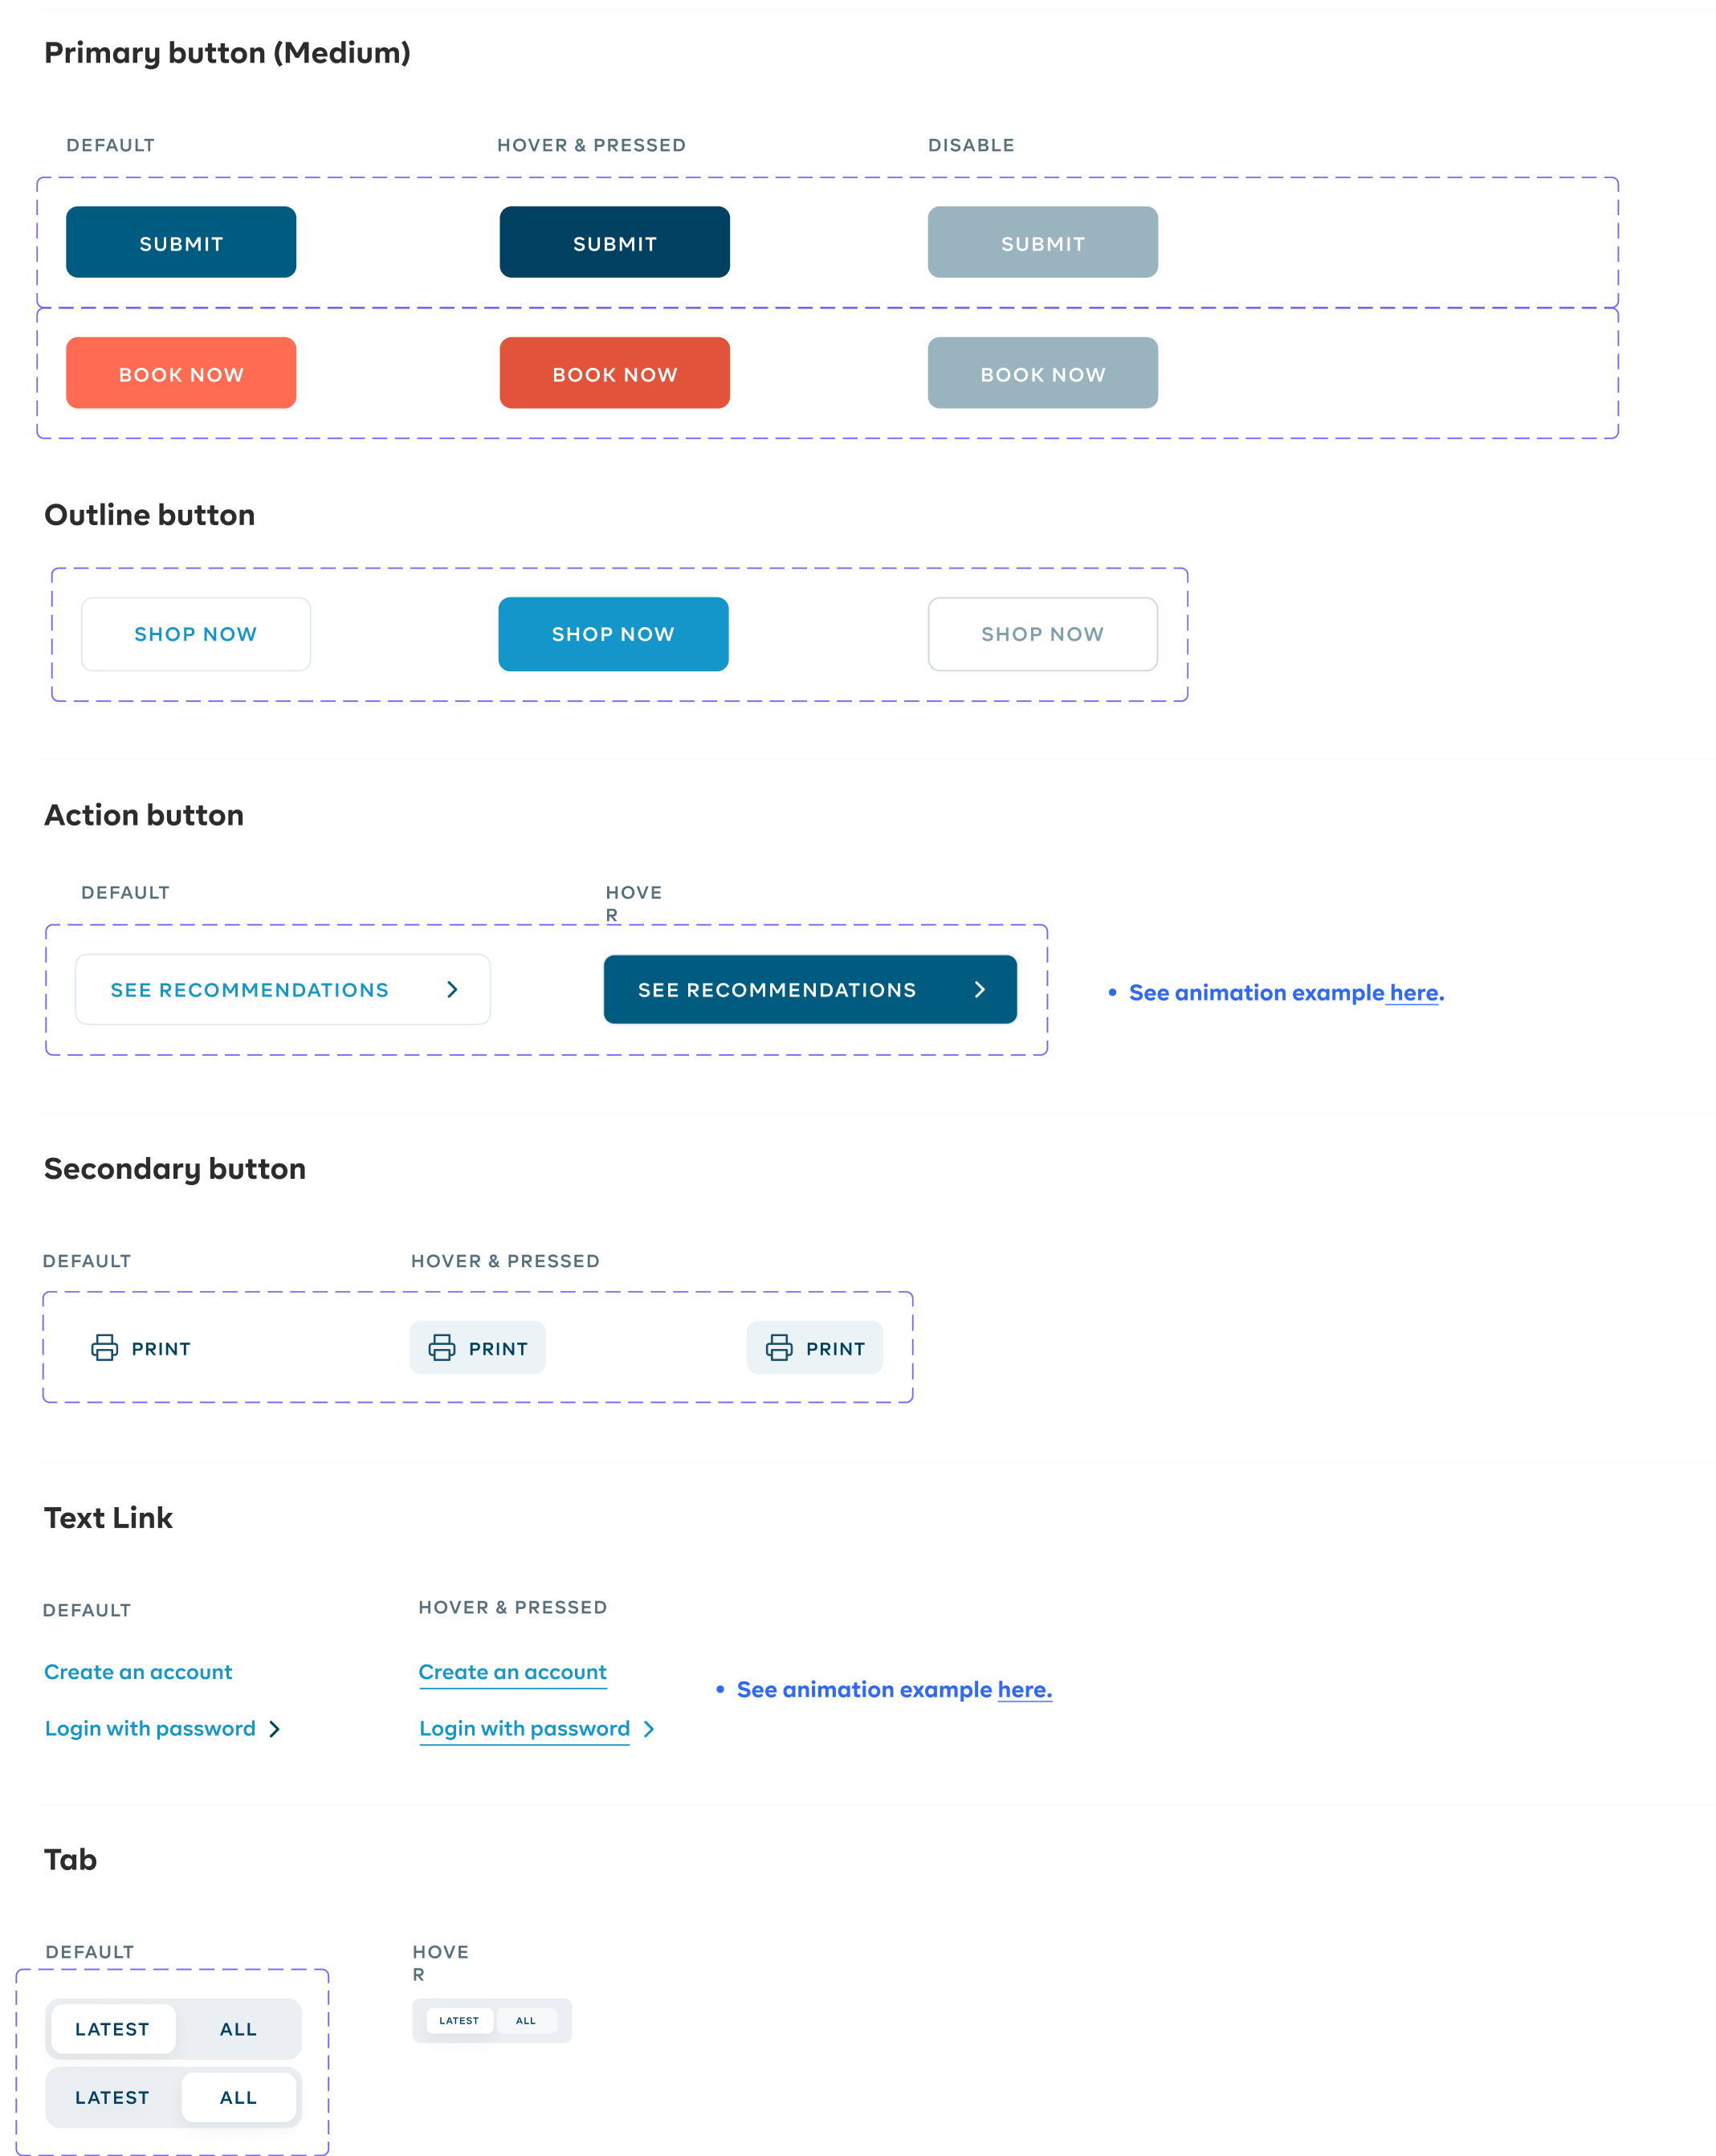

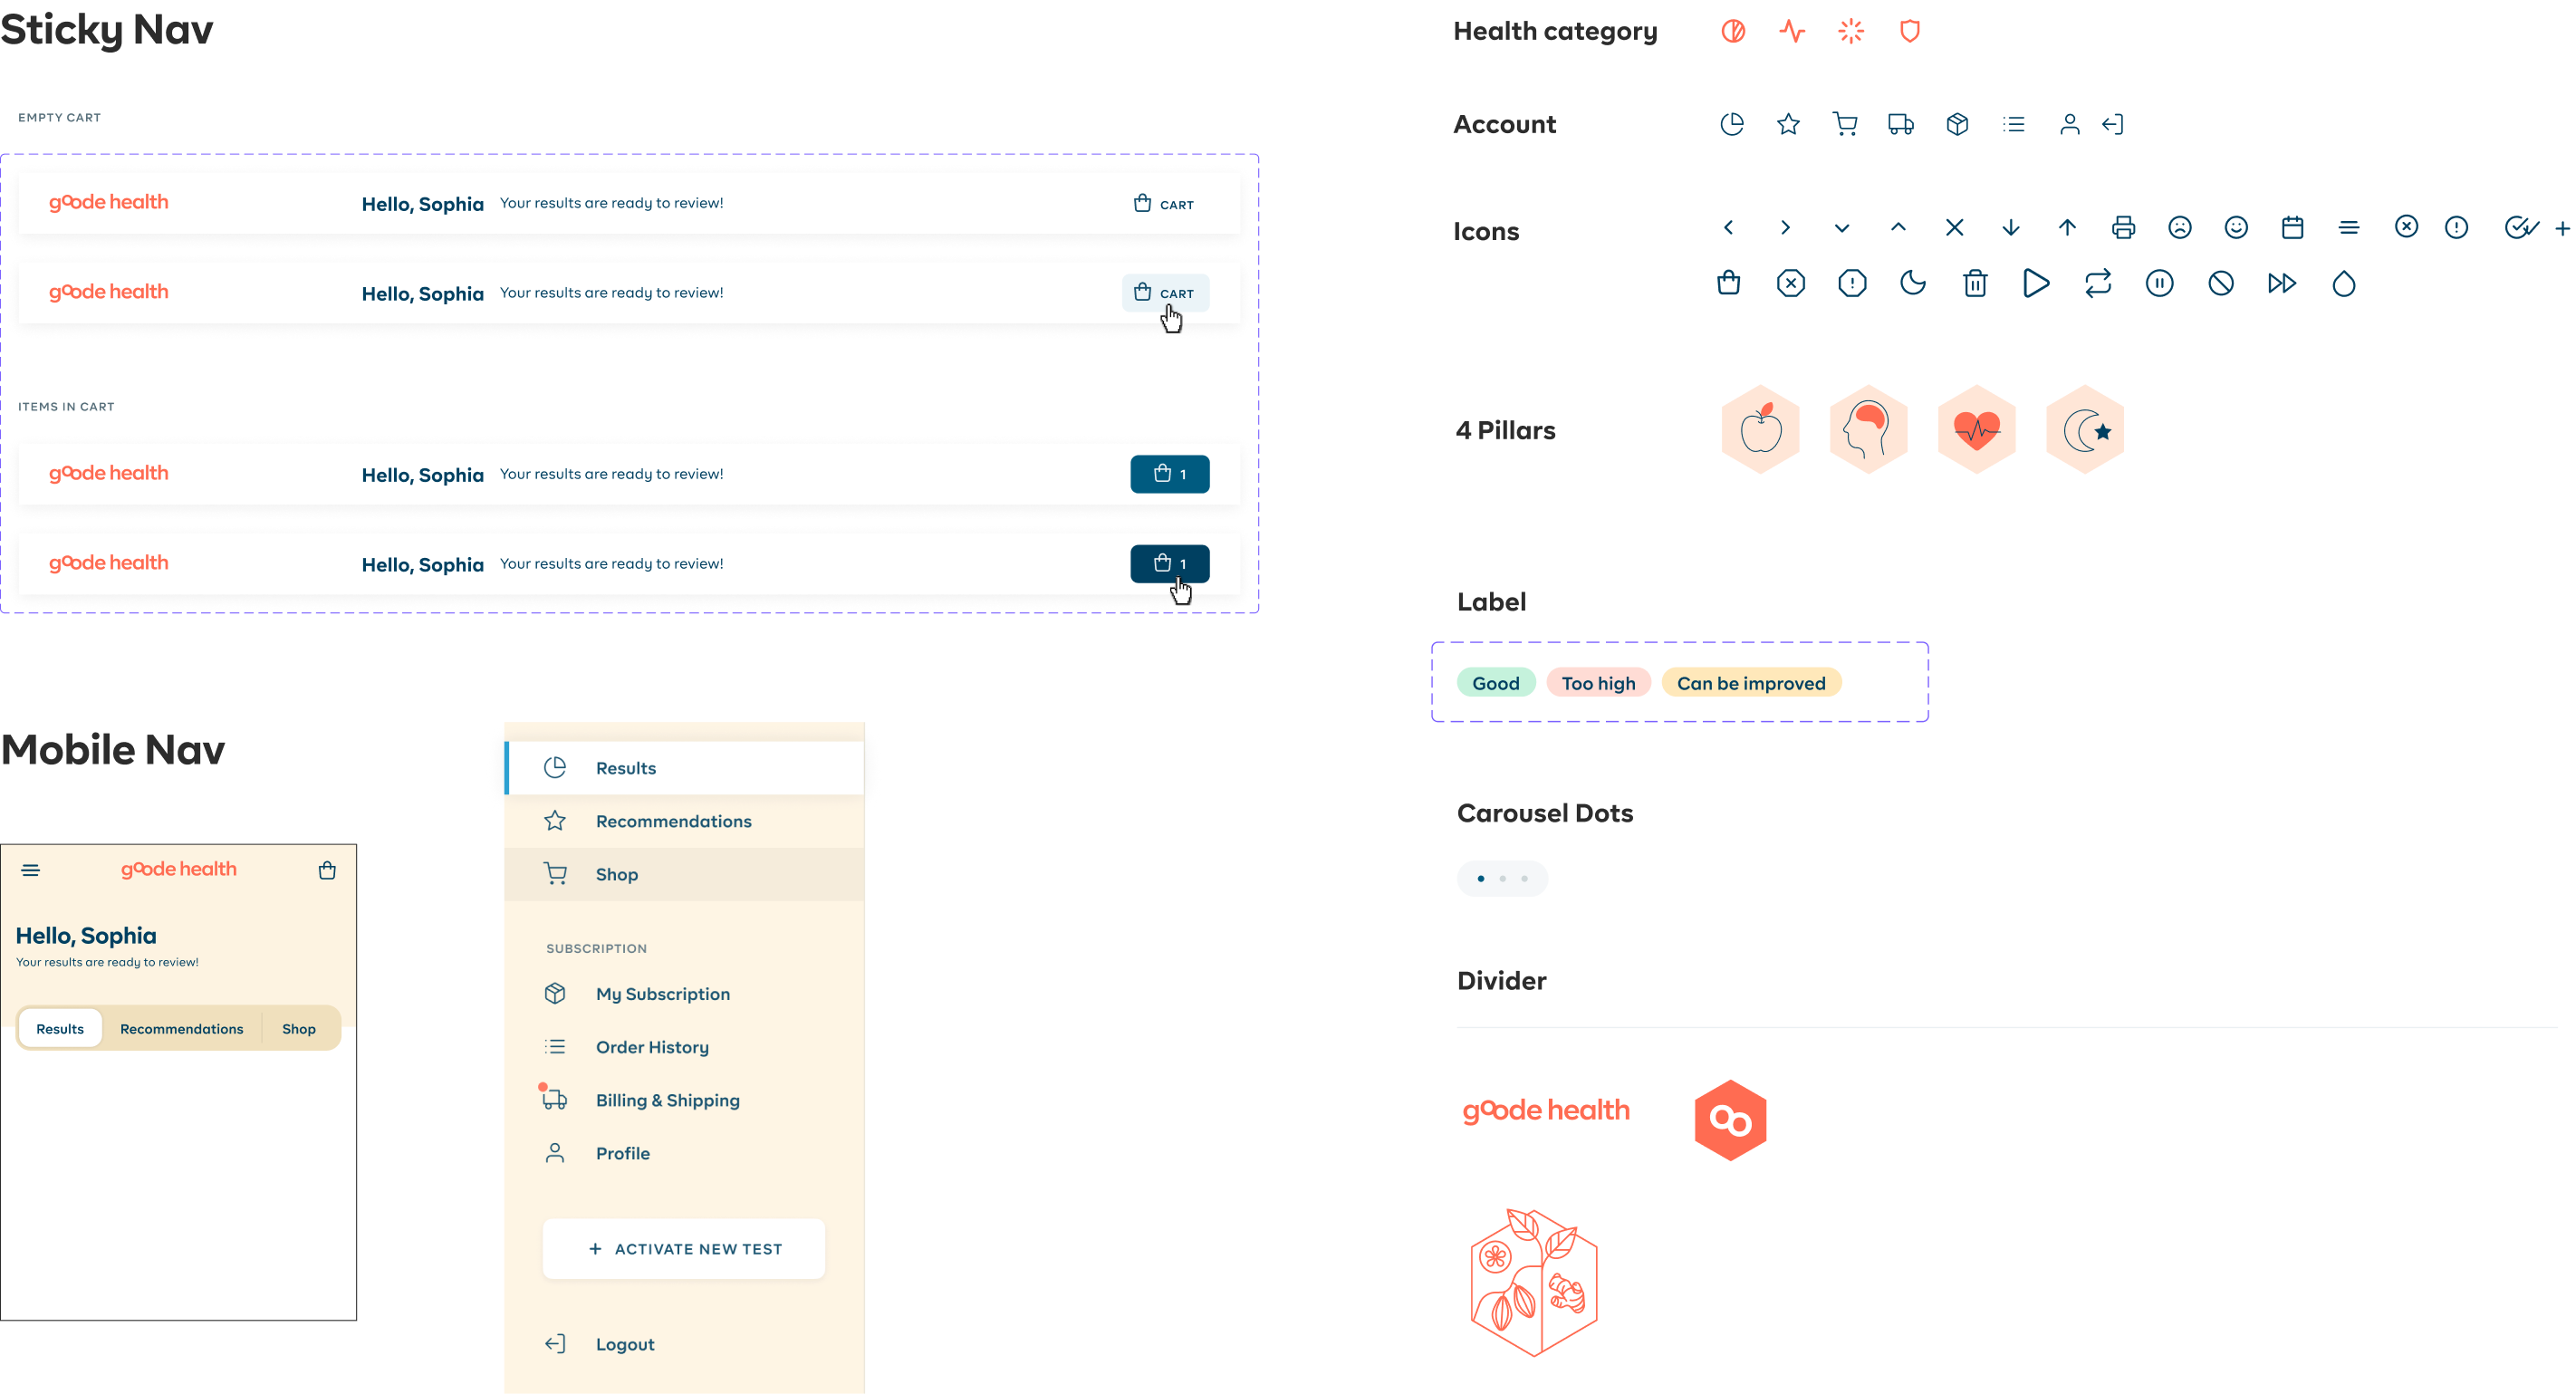
Elements cont'd

Addressing Principles and Goals
It was at this stage we were making sure our solution incorporated our design principles and goodehealth's business goals.Bridge the gap between physical and digital aspect of the product
To address this issue nudges were implemented. For starters, those waiting on their blood test kit to be analyzed by the lab, or the shipment of their superfood blend.Nudge Component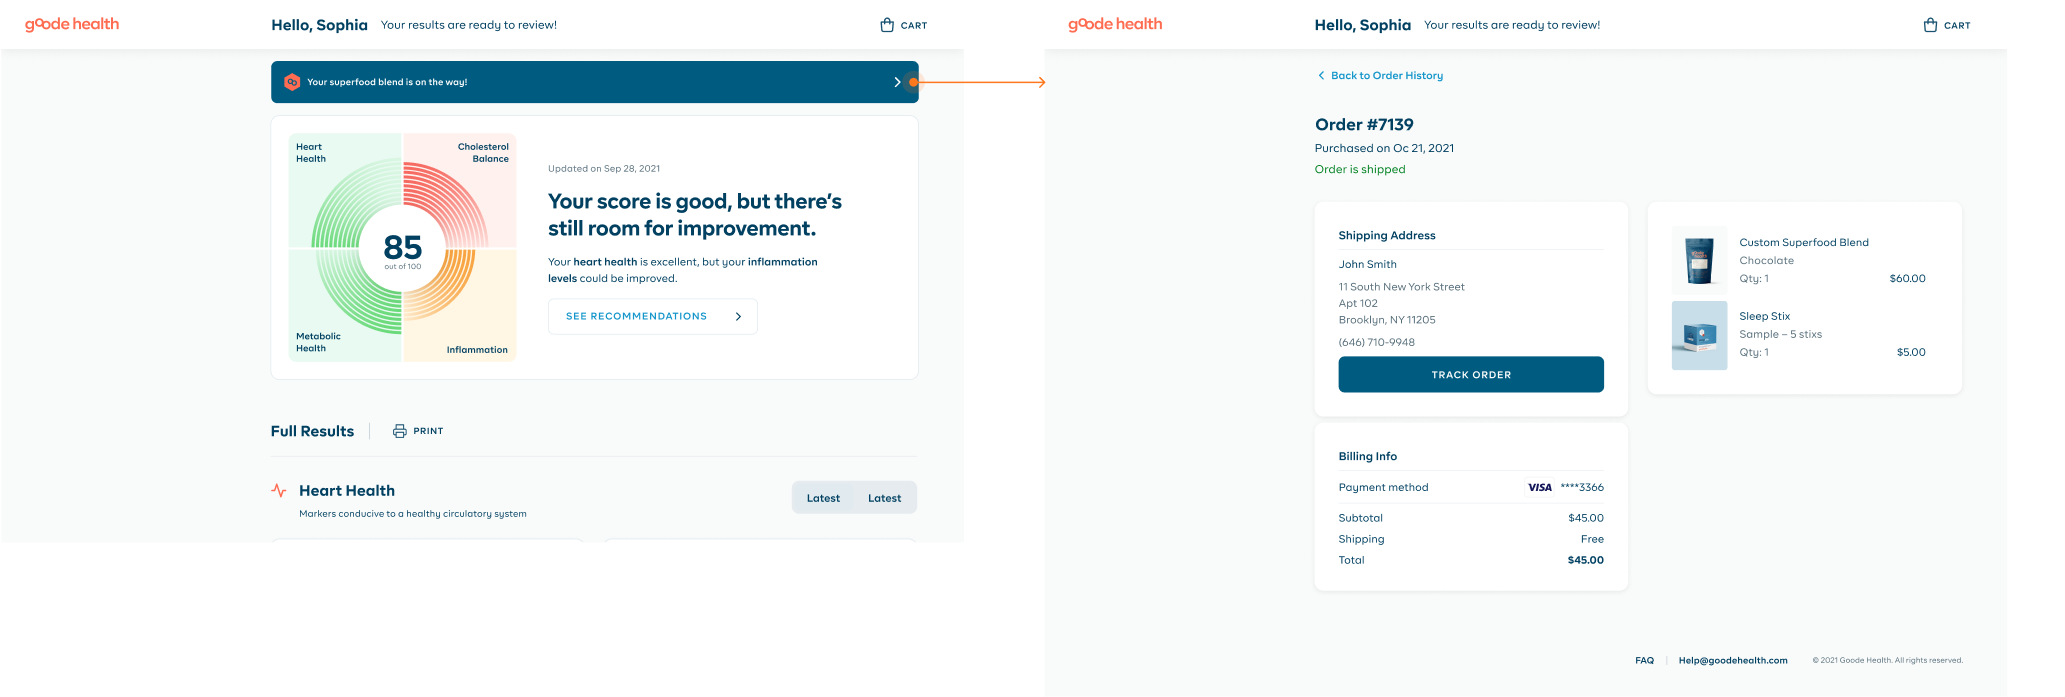 They can also monitor progress of their test kit directly from the dashboard. Previously users would had to rely on e-mail communications only.
Modernize the UX from a heuristic perspective
Clearer system status was addressed by anytime a change is made to a user's account a tool tip modal briefly appears. Loading screen icon to go with the brand's motif and to provide a smoother transition.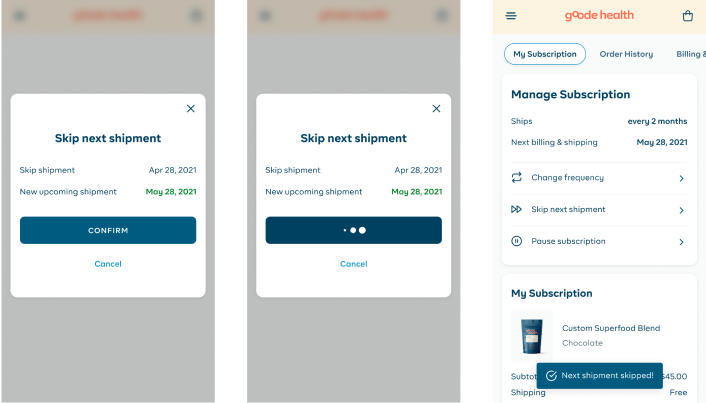 Loading state, changes saved tool tip
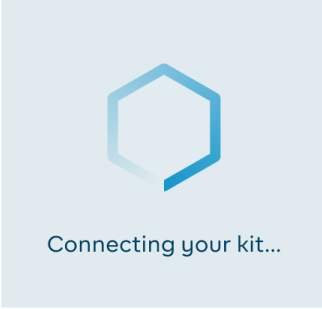 Connecting kit state
 System Processing Button State
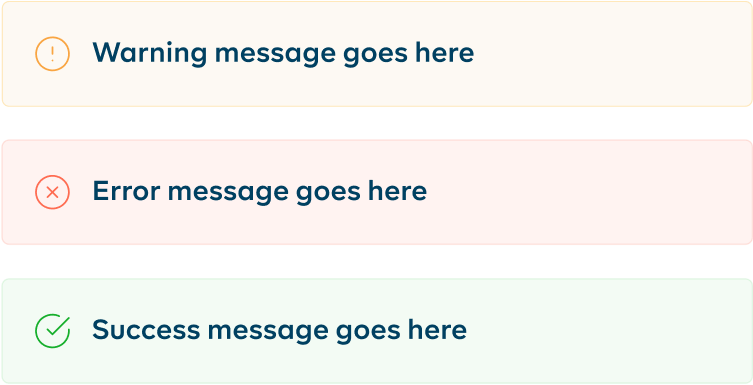 System Message Bubbles
Address the major CX paint points

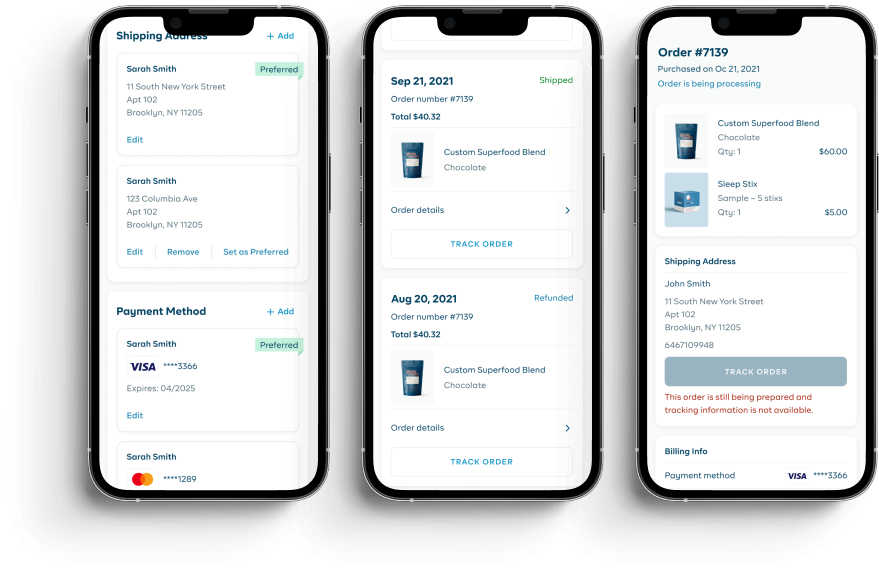
My SubscriptionTo address the pain points caused by subscription management for customers and customer experience the entire journey was reworked from the ground up. Working closely with the developers to validate my designs. Also ensuring that we could offer all the same features the users are used to and new ones.
Educate, and empower users to explore the product
Biomarker Card ViewThis was addressed by creating a system to better visualize the individual health markers.
Creating this broader scope lessens the confusion behind the scientific language previously being used.
- Severity levels
- Total Score
- Varied by individual biomarker
Creating this broader scope lessens the confusion behind the scientific language previously being used.

Health ScoreHaving the final design emphasize the colour ranges, density of rings and overall score makes for a concise snapshot of health for the user to explore upon.

Biomarker “Latest” ViewWith the final design of the bars we decided to show the range the user was in with the colour of that range highlighted within the range. This made the most sense as there are some biomarkers where having a higher value is actually seen as severe. (HDL)

Biomarker Graph View
The intention here was to further educate and provide ways of actions users could improve their biomarker on.
- Individual Data History
- Colour to communicate severity ranges
- Information to educate user regarding biomarker
The intention here was to further educate and provide ways of actions users could improve their biomarker on.

Business Goals
Increase In activation of rate of the blood test kit product
Increase in users ordering recurring blood test kits
Blood test kit presenceIncrease friction in registration flow and mentions of the blood kit throughout the experience
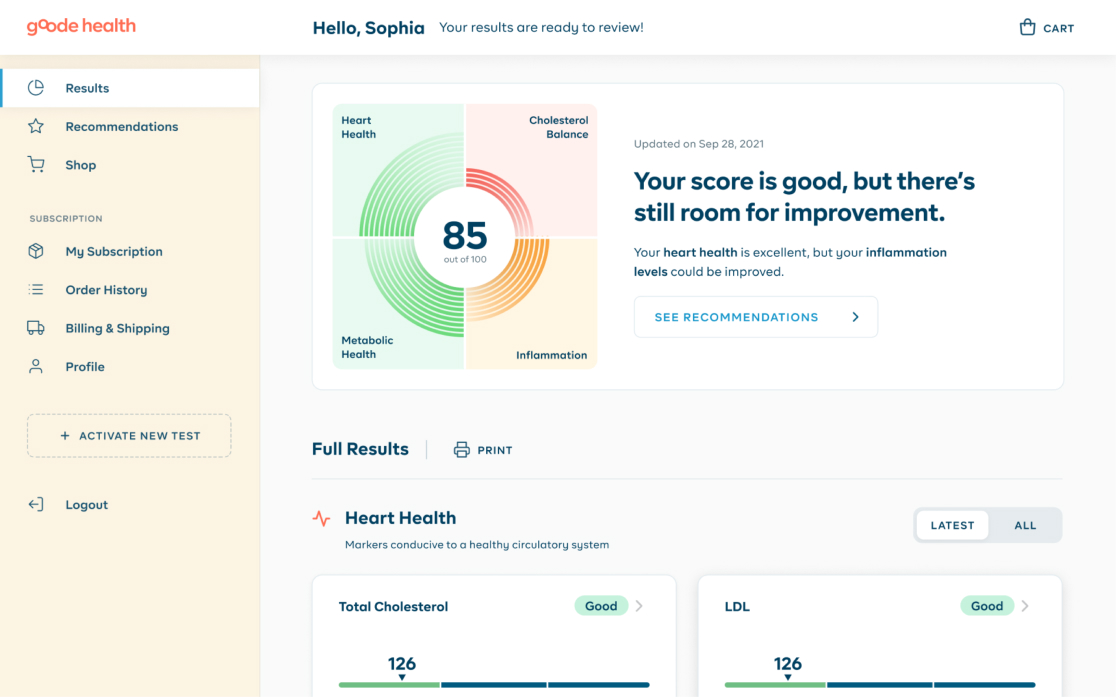 Kit activiation CTA on main navigation
Acquisition of more users for their partner services (i.e. Health coaching, Stix Products)
Upsells placed in strategic spotsIntroducing call out CTA's to different products offered by Goodehealth within the main experience.


The Solution
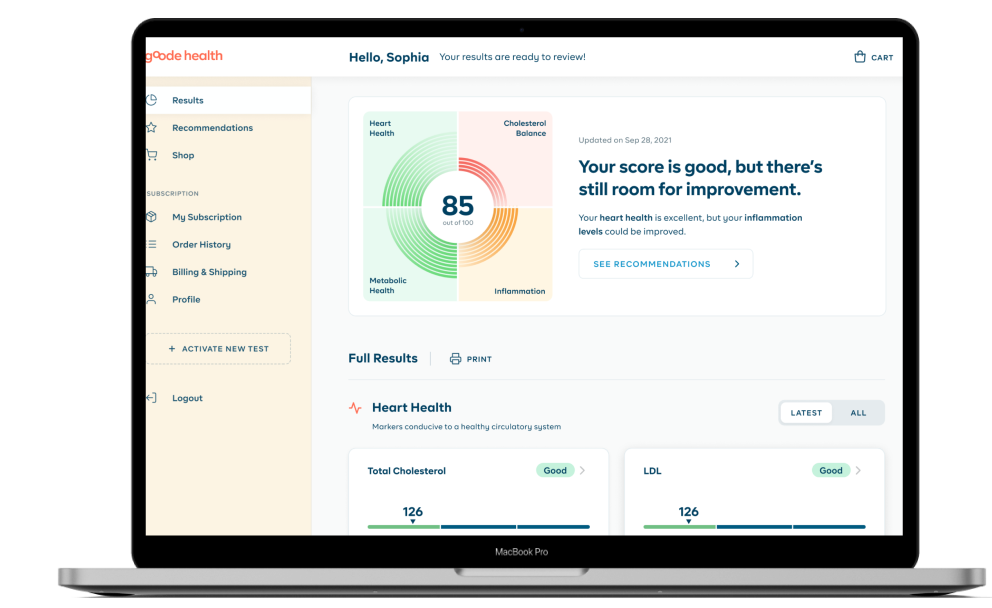
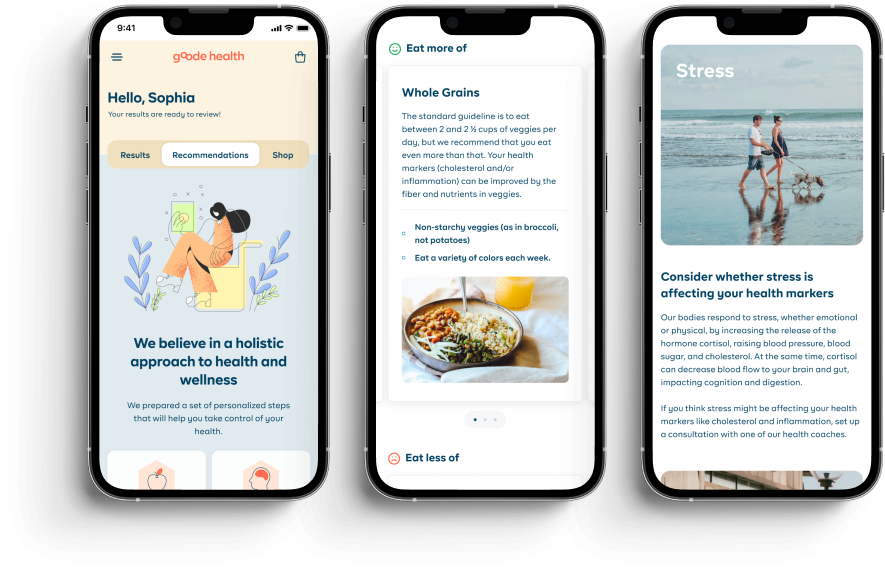
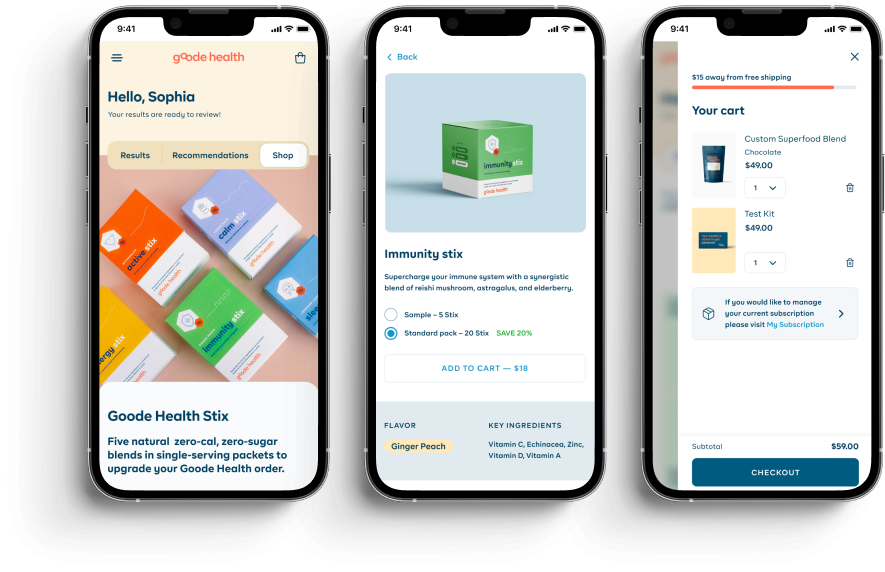
Reflection
Cross Functional
Designing for web has its own unique challenges. Working closely with developers helped me learn the limitations that arise when creating a product for the web.Cross Platform
Addressing issues that were present from a physical perspective interested me the most as goodehealth's product has distinct digital and physical aspects that need to work within a single context.Onwards
As the timeline was very tight for this project we weren't able to conduct formal user tests. I would love to in the future draft up a test plan in which we can hope to validate the decisions we made during this sprint.derman sultan • 2026I'm always up for a chat ☕Get in touch below or directly at abdurrehmansultan4@gmail.com